Analyzing Bias with Text, Images, And Sound
This year I presented one of my papers at the virtual ASSA 2022, one of the most well-known international conferences in economics. I took the opportunity to also listen to some really interesting sessions from some colleagues in the field. One session was especially interesting to me, as it combined a topic I am really interested in with data science methodologies I am really interested in. The session had the name of this blogpost “Analyzing Bias with Text, Images, And Sound”. The session consisted of 4 papers analyzing text, images and sound to detect bias (as the title might suggest). So let’s have a brief look at each of the papers to understand how we can use cool new data sources to disclose stereotypes and biases.
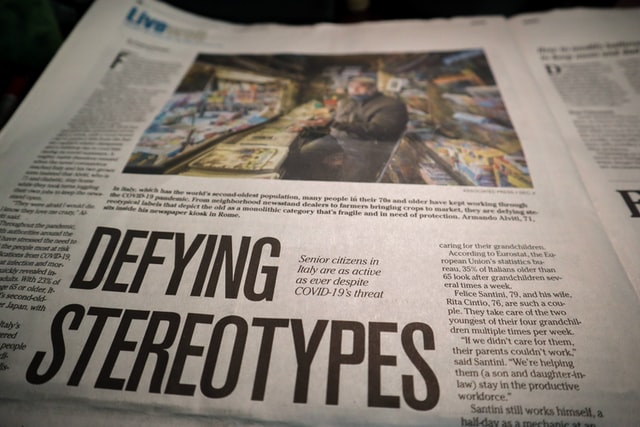
Paper Number 1: Visual Representation and Stereotypes in News Media
In this paper, the authors use 2 million web articles from the New York Times (NYT) and Fox News Channel from 20 years (2000-2020) and the related text, images, and metadata (such as the date, section and byline) to provide evidence on stereotypes in the media. They apply machine learning algorithms to detect the gender and ethnicity from an image. The researchers additionally conduct a topic modeling exercise. What they find is that the representation in the newsroom strongly influences the image choice in the news articles. Let’s have a look at that in more detail.
The authors use a machine learning classifier to predict Gender (male/female) and Ethnicity (White, Black, Hispanic, Asian, Indian, Arab) of images. More specifically, they apply a deep-learning classifier called face_recognition, which has the ability to recognize faces in images. They then apply FaceNet to convert the pixel into numeric representation (a vector of numbers). They then feed this into a Neural Net, performing the actual prediction, and giving out race and gender. Lastly, the paper contains a number of validation exercises to check on the quality of this prediction. What the paper finds is that women as well as Hispanics are heavily underrepresented in news images when compared to the US population. When taking a deep dive and looking at different newspaper sections, they find that women are underrepresented in every section (entertainment, travel, health, real estate, US, Science, Tech, Politics, World, Auto and Sport) but the Lifestyle section. Hispanics are underrepresented in every single section while Whites are heavily overrepresented in every section but the World and Sports section. In addition, Blacks are underrepresented in every but the Sports, Entertainment and US section. [Foto by Little Plant]
Next, they analyze if certain groups are more related to certain topics, namely crime, poverty and immigration. They identify these topics through a list of keywords. They find a positive association between African American faces and crime, and show that this association is more significant in the case of FOX than NYT. On the contrary, when looking at the association with poverty, the association is again positive but larger for the NYT than FOX. And lastly, there is a positive relation between immigration and Hispanics, which is larger for FOX than the NYT. The differentiation of FOX and NYT is interesting, as FOX is a more conservative outlet while NYT is a more liberal one. The researchers then go ahead and apply a Ridge Regression to detect the most predictive words in the media text with each identity group, and find large differences. Moreover, they find that the image choice is partially driven by occupation stereotypes (as an example Blacks and Hispanics are associated with low-skilled jobs, while Asians are associated with high-skilled jobs and science). Lastly, they code the gender and ethnicity of each editor and author from the New York Times and investigate if the share of each identity group among editors and authors influences the share of these identity groups in the media images. And indeed, the more authors of a given identity you have, the more likely these identities will be represented in the media images at use.
Paper Number 2: Emotions and Violence: The Effect of Biased News on Hate Crimes

The next paper presented in this section asked if media reporting on immigration and refugees can play a role in generating discriminatory attitudes, beliefs or actions towards immigrants. It analyzes whether media bias can induce actions, such as hate crimes. The author asks if the media discusses immigration, how it discusses it (media bias), and if it influences hate crimes. In order to measure this, the researcher applies a machine-learning-method, namely an audio-to-emotion algorithm, which lets him detect the degree of anger in the media. The paper establishes causality through an exogenous “trigger” of violence, in that case, unexpected NHL hockey losses. The question then is if unexpected hockey losses stimulate violence against immigrants when media coverage of immigration has been higher than usual, and/or angry. [Foto by Markus Spiske]
In order to give an answer to the question, the author takes advantage of FBI Hate Crimes data as well as media data, namely GDELT and TV Archive, covering Fox News, CNN, and MSNBC, and its related text and audio. He also uses Sports data from the Odds Portal, which gives information about betting odds. He then uses a number of bias algorithms, one being the audio-to-emotion algorithm. This algorithm is trained on labeled data consisting of actors saying the same thing with different emotions (namely neutral, happy, sad, fear, and anger). He additionally applies a state-of-the-art Natural Language Processing model in order to detect slant. This algorithm makes it possible to detect anti-immigration notations and was trained on congressional speeches, in order to predict immigration grades from NumbersUSA.
What he finds is that an extra unexpected NHL hockey loss generates a 12 percent increase in local anti-immigrant hate crimes for every increase in immigration coverage in the media (by one standard deviation), and an additional 9 percent increase if the media coverage was angrier (by one standard deviation). This is mainly driven by hockey losses generating violence and by the Fox News viewership. Media slant (anti-immigration notation) cannot explain the results.
Paper Number 3: The (great) Persuasion Divide? Gender Disparities in Debate Speeches & Evaluations
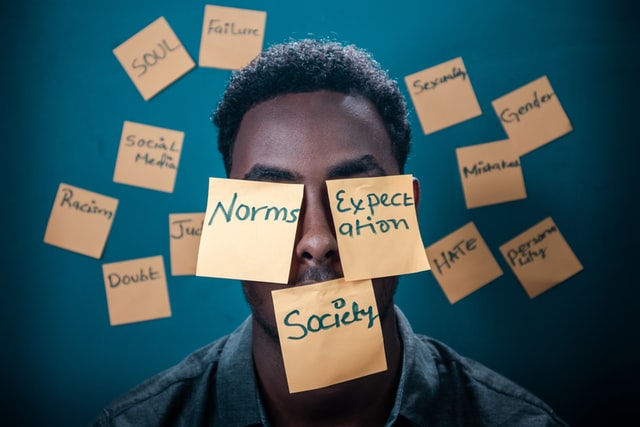
This paper is about the gender gap and persuasive speech evaluation. The researcher motivates this work by saying that persuasive skills are crucial in high-level careers, and that, at the same time, there are less women than men in these high-level positions. She then asks whether this gender gap has to do with differences in the way men and women persuade, and if gender matters in persuasive speech evaluation. She takes advantage of 1517 speech transcripts, evaluation scores and demographic data from highest-profile intervarsity debate tournaments. She finds that there is indeed significant variation in the way that male and female speakers persuade. More specifically, women are more prone to using personal and disclosing speaking styles. They negate less when answering to opponents and give longer and vaguer answers. As traditionally these characteristics are associated with less points in speech evaluation, they score lower on average than men. [Foto by Yasin Yusuf]
Paper Number 4: Physician Practice Style for Mental Health Conditions: The Case of ADHD
The last paper presented in the session uses natural language processing to analyze doctor note text. The paper asks if there are differences in the way that physicians diagnose the Attention Deficit Hyperactivity Disorder (ADHD). They find there is indeed significant variation in, first of all, the mean propensity to diagnose ADHD, and second of all, the closeness of the diagnoses to medial guidelines. These differences can be partly explained by the characteristics of the physician, such as their gender. The researcher shows that women and recent graduates have a lower propensity to diagnose ADHD, and follow more closely the existing medical guidelines.
How to use cool new data sources to disclose stereotypes and biases
The session I summarized here to you just gives a glimpse into all the cool stuff we can do with Machine Learning and data in form of text, audio and images. There are many more papers out there, and there have been never seen opportunities to outlie biases and stereotypes in our society.